Tuesday, April 19, 2005
a day in the life
Last Thursday saw me up at 3am to head to New Bedford [nu-BEH-feh(d)] for an ADCP survey. ADCP stands for Acoustic Doppler Current Profiler and the instrument looks like this. We essentially mount this thing in the water over the side of the boat. It “looks” down through the water and can measure how fast the water is moving from top to bottom. If you drive the boat across the flow, you can get a reasonable cross-section of velocity.
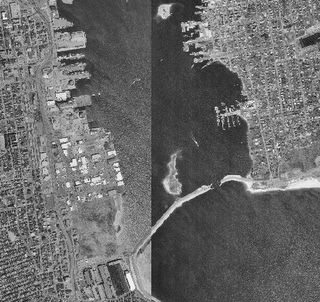
Here’s an aerial photo of New Bedford harbor.

You’ll notice the thin strip of land at the bottom center which has a small gap in it. This is the hurricane barrier which was built after the hurricane of 1938. The 150-foot gap in the middle can be closed to prevent flooding from hurricanes and coastal storms.
We were driving back and forth across the gap every half-hour for about 14 hours. The output from the ADCP for one of these runs looks like this

You can see that the higher velocities (blue colors) are only near the bottom. This is partly because the wind was blowing steadily from the north all day. So when the tide was flooding (going into the harbor from the south) you see the water on the bottom moving but the water at the top is being slowed down/stopped by the wind blowing against it. Later on the currents overcame the wind and you could see the tide moving from the bottom to the top.
Once the tide switches direction and starts to ebb, you see that the flow is located only over the top of the water column.

Just as the tide changes direction, there is normally very little flow at all, but here you see the surface of the water being pushed out due to the wind blowing on it. Again, once the tide got moving, water was flowing throughout the water column.
So that's what I did at work last Thursday. Later on when I'm trying to model the flow in and out of New Bedford Harbor, I can use this data to make sure I'm getting it right.
Last Thursday saw me up at 3am to head to New Bedford [nu-BEH-feh(d)] for an ADCP survey. ADCP stands for Acoustic Doppler Current Profiler and the instrument looks like this. We essentially mount this thing in the water over the side of the boat. It “looks” down through the water and can measure how fast the water is moving from top to bottom. If you drive the boat across the flow, you can get a reasonable cross-section of velocity.
Here’s an aerial photo of New Bedford harbor.

You’ll notice the thin strip of land at the bottom center which has a small gap in it. This is the hurricane barrier which was built after the hurricane of 1938. The 150-foot gap in the middle can be closed to prevent flooding from hurricanes and coastal storms.
We were driving back and forth across the gap every half-hour for about 14 hours. The output from the ADCP for one of these runs looks like this

You can see that the higher velocities (blue colors) are only near the bottom. This is partly because the wind was blowing steadily from the north all day. So when the tide was flooding (going into the harbor from the south) you see the water on the bottom moving but the water at the top is being slowed down/stopped by the wind blowing against it. Later on the currents overcame the wind and you could see the tide moving from the bottom to the top.
Once the tide switches direction and starts to ebb, you see that the flow is located only over the top of the water column.

Just as the tide changes direction, there is normally very little flow at all, but here you see the surface of the water being pushed out due to the wind blowing on it. Again, once the tide got moving, water was flowing throughout the water column.
So that's what I did at work last Thursday. Later on when I'm trying to model the flow in and out of New Bedford Harbor, I can use this data to make sure I'm getting it right.
